Are you responsible for sales results? Are you responsible for the work of the branches or do you want to check the progress in implementing the plan? The Monthly Report will help you analyze the current sales trend, facilitate the search for the best and worst performing branches and indicate in advance the places that require your support. The Monthly Report has been prepared in such a way as to

The situation in the area of increasing public debt is very serious in many European countries.The level of GD and its share of GDP are important indicators that deserve close monitoring.The purpose of the charts is to show how the public debt in the EU countries changed in years 2000-2020. The analysis was performed on the basis of data from https://ec.europa.eu/eurostat using the Animated Race Bar Chart in functionality Tableau.
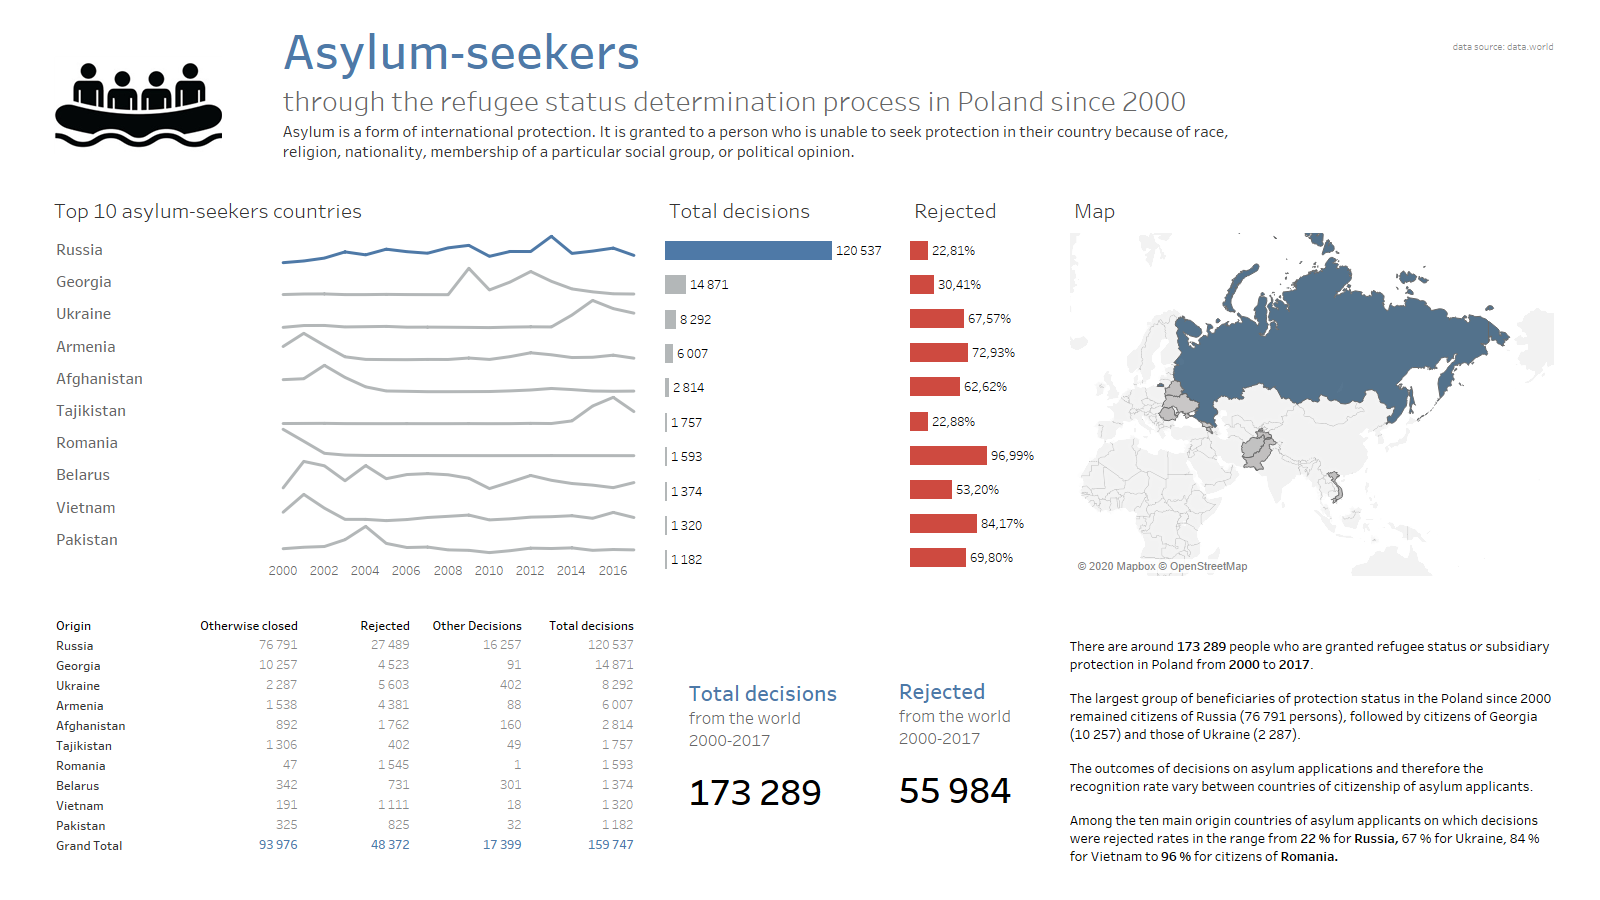
Have you ever wondered how many refugees applied for asylum in Poland between 2000 and 2017? Which country received the most and the fewest asylum applications? How many asylum applications have been accepted and rejected? In which year was the largest increase in the number of asylum applications submitted for a given country? Let’s try to answer those questions with some data analysis. There were around 173 289 people who
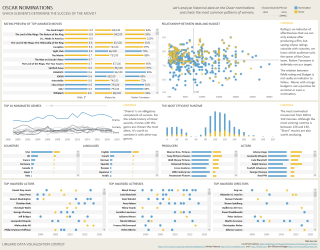
You are a movie producer and would like to know what kind of movie you should invest in and what people should you hire in order to increase the chances for making a successful movie? Probably it’s not your everyday concern 🙂 Unless, like me, you decided to create a Dashboard for Movie Producer for the purpose of the Data Visualization Contest organized by Lingaro! Contests in data visualization category
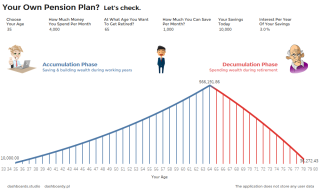
How long you need to save money for your own pension plan? How many years you can cover your expenses? What amount should you collect to get a quicker retirement? Use our dynamic dashboard – fill out and see for yourself! The application does not store any user data. Let’s check a few simulations: You are a young 24-year-old person at the beginning of your career, without any savings, spending

Making business decisions is not an easy process but it’s much easier when you use dedicated tools that provide key information about your company. Let’s check the most important advantages that are common for the top Business Intelligence providers BI delivers data from all systems. BI platforms let you merge data from all systems that are already implemented in your company. The ERP, Stocks, Sellings, CRM, HR, Orders, Sales data
What our community will look like in next 30-40 years? Who will be working for our retirement? What is the future of Polish society? Let’s try to answer those questions with some data analysis using age pyramid visualization. What official statistics say and what does it mean? Polish government has a great data regarding historical and current community statistics. A lot of them are available on stat.gov.pl and my analysis
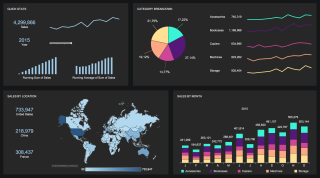
This time I’d like to share something new. Dashboard with dark background and rectangle sections for specific groups of measures. I called that “modern dashboard” because of its unusual design and colors, but in general it’s still a standard overview dashboard covering Sales metrics and some business questions can be answered. Running Sum of Sales and Running Average of Sum of Sales. As you know – Running Sum or Running
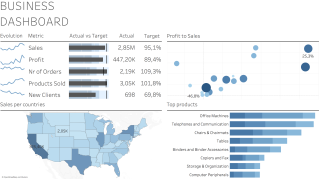
Hi there! Check my another Tableau dashboard from “viz for fun” series. This is a clean, easy to read Business Dashboard with the most important metrics for management purposes. It is indeed different from what I have shown so far. Huge metrics, large fonts, limited measures’ values – I believe this is good enough for quick morning review of your business without further analysis. Enjoy and let me know if
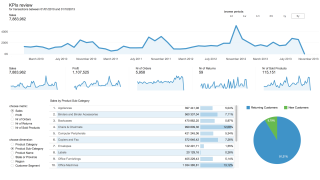
Whenever it’s possible I prefer creating one-dashboard-only Business Intelligence applications. But how can I fit all visualizations for so many KPIs on one screen? Here is the solution. Dynamic version of KPI dashboard in Tableau Gallery is here. One general dashboard with dynamic measures and dimensions. Most of business KPIs are analysed on trend chart and this one comes as main viz on the dashboard. Usually it takes a lot